Welcome to another entry in our series on Dr. Wayne Winston’s best Excel tips! I’m Wayne Winston, Becker’s resident expert on all things Microsoft Excel. Let’s learn another helpful Excel skill that can make your work a bit easier.
Last month, we showed you how to use Office 365’s amazing new Data Types to extract thousands of pieces of data from the web into Excel, including the population of your city, all albums sung by a certain artist, and much more. This month we will show you how to enter weather data for a specific location into Excel.
Suppose you live in Houston, Texas (the city has amazing restaurants and gets no credit for them!) and want to extract to Houston’s average monthly temperature and average monthly maximum temperature. If you have Office 365, you can use the following steps to accomplish this goal. Copy and paste this link into a new browser window to download the workbook and follow along.
1. Type “Houston” in cell G7 of the workbook.
2. Select cell G7. In the Data tab, choose “Geography” from the Data Types group. You will have to choose the correct option to tell Excel that Houston is a city.
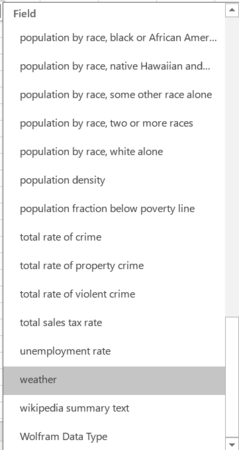
2. In cell H7 type =G7 and you will see a list of data (see Figure 1) you can download. Select Weather.
Figure 1: A Subset of available data for Houston, TX

3. In cell H7, you will see weather for Houston. Click on the card icon and choose “history.” Cell I7 will now contain weather history for Houston.
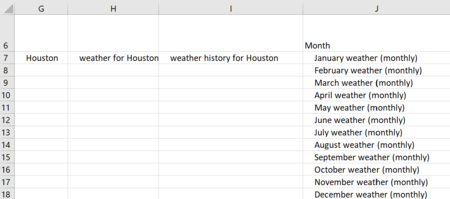
4. Click on the card icon in cell I7 and choose monthly. Cells J7-J18 will appear as shown in Figure 2.
Figure 2: Column J shows available monthly data

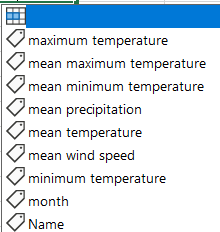
5. Now, if you go to any blank cell and point to J7, you will see the options available below (Figure 3). Entering the formula J7.month in K7 and copying the formula to J8:J18 enters the months of the year.
Figure 3: Monthly weather options

6. Copying from L7 to L8:L18 the formula = J7.[mean temperature] enters each month’s mean temperature in degrees Celsius.
7. Copying from O7 to O8:O18 the formula = J7.[mean maximum temperature] enters each month’s mean maximum temperature in degrees Celsius.
8. To convert the monthly mean temperatures to Fahrenheit we copied the formula = (1.8*L7+32) from M7 to M8:M18. We also converted the mean temperatures with Excel’s CONVERT function by copying the formula = CONVERT(L7,"C","F") from N7 to N8:N18. The CONVERT function makes it a snap to convert from one system of units to another (for example, feet to meters, etc.)
9. In column P, we used the CONVERT function to convert the maximum mean monthly temperatures to degrees Fahrenheit. Our data is shown in Figure 4.
Figure 4: Monthly temperature data for Houston, TX

10. We can now summarize our data with a line chart. Select the cell range K7:K18. Then, hold down the control key and select N7:N18 and P7:P18. Selecting a line chart (Insert à charts) creates the line chart shown in Figure 4. As all Houstonians know, summers are hot in Houston!
Learn more with Excel CPE
Excel offers a wide variety of functions, formulas, and automation that can save you hours of work while improving accuracy and outcomes. To help you make the most out of this software, we offer a wide variety of CPE courses to support your learning!
Check out Becker's wide range of CPE courses that teach you to make the most of this powerful tool:
- Excel: Technical Analysis Trading Strategies
- Excel: Enterprise Risk Management
- Excel: Magic with Excel
- Excel: Solve Hard Problems in Corporate Finance
- Excel Metrics: Best Practices
- Python for Excel Users: A Gentle Introduction
These and many more Excel-focused, CPE credit-earning courses are included in Becker's Prime CPE subscription. Sign up now for 12 months of access to over 1700 on-demand, webcast, and podcast CPE courses!


