

As a professional accountant or licensed CPA, your time in Microsoft Excel may seem unlimited. You'll need to understand how Excel works, and be able to use your spreadsheet skills to share the financial status of your employer. Luckily, Excel provides tools to help you connect the dots.
In 2016 Excel added many new charts, including the waterfall chart. A waterfall chart highlights how a value either increases or decreases over time to reach an end value. Waterfall charts are great for telling the story of how a quantity of interest (for example, cash position) changes over time. With a waterfall chart, Excel allows you to chart for a single point in time and shows how a quantity (such as total revenue) “steps down” into a final quantity, like Before Tax Profit. Learning how to create a waterfall chart in Excel can be useful to share how much cash your organization has throughout a given time period, or changes in revenue and profit.
How to create a waterfall chart in Excel
You can quickly create a waterfall chart in Excel 2016 that summarizes situations such as changes in cash flow position and the stepping down of revenue into profit. The following step-by-step instructions share how to create a waterfall chart in Excel to visualize a company's cash position and how to color code the chart for easier understanding.
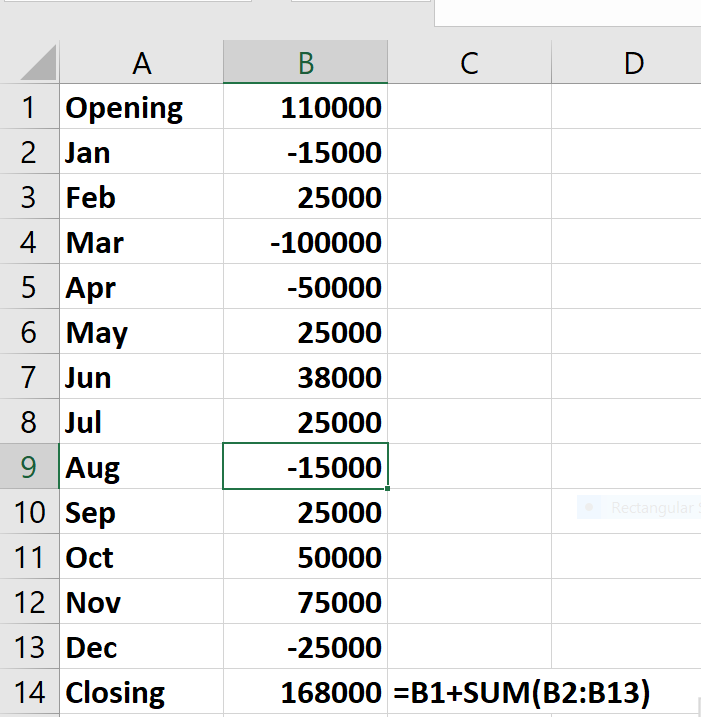
Copy and paste the link to this file Beckeroct19.xlsx in a new window to follow along in Excel. In the worksheet Cash Flow (see Figure 1) we are given a company’s beginning of the year cash position ($110,000), monthly changes in cash position and the end of year cash position ($168,000.)
Setting up a basic waterfall chart
A waterfall chart makes it easy to summarize the ebb and flow of the company’s cash position.
To set up the waterfall chart in Excel, follow these steps:
- To begin, select the range A1:B14.
- From the Insert tab, choose the last chart icon in the first row.
- Choose the Waterfall Chart Icon (shown in Figure 2.)

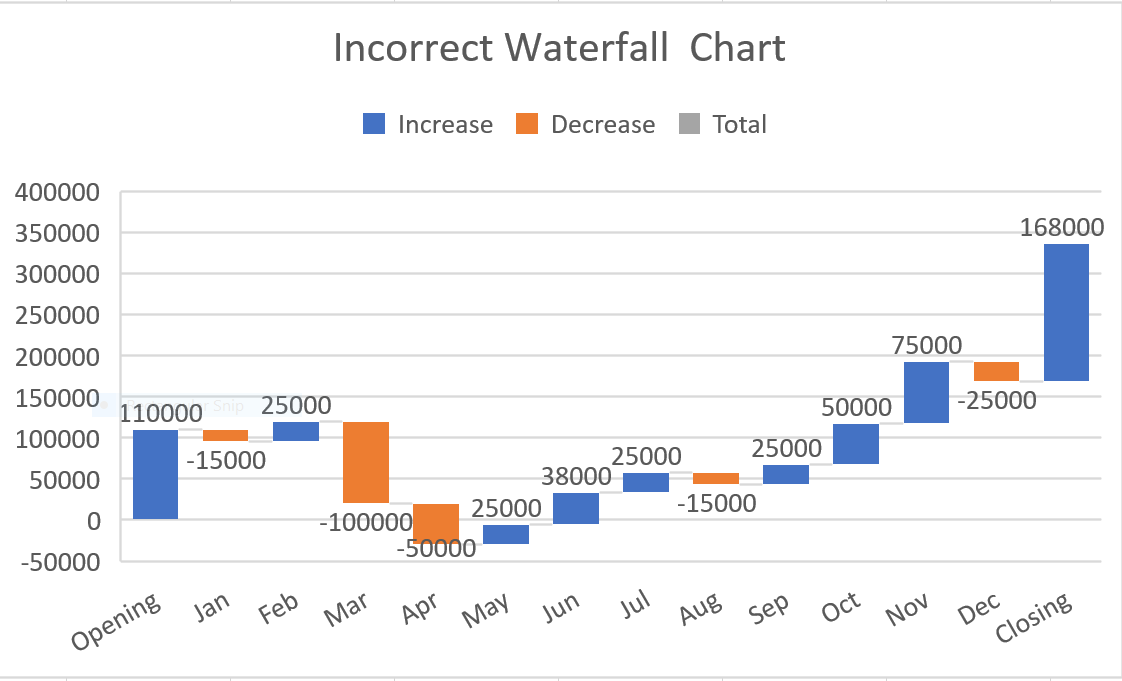
You will now see the waterfall chart shown in Figure 3.
Color coding a waterfall chart
Note that positive cash flows are shown in blue and negative cash flows are shown in orange. This color coding makes it easier to tell when cash flows are higher or lower than 0. The problem with this chart is that we would like the Opening and Closing Cash Positions to be in a different color (say, gray) and anchor the Closing Cash Position to 0. Changing the cash position colors will help make the story easier to understand by adding context.
To accomplish this goal, follow these steps:
- Put the cursor on the Opening bar and click until the bar is selected.
- Right click and choose Set as Total. Then, the first bar will turn gray.
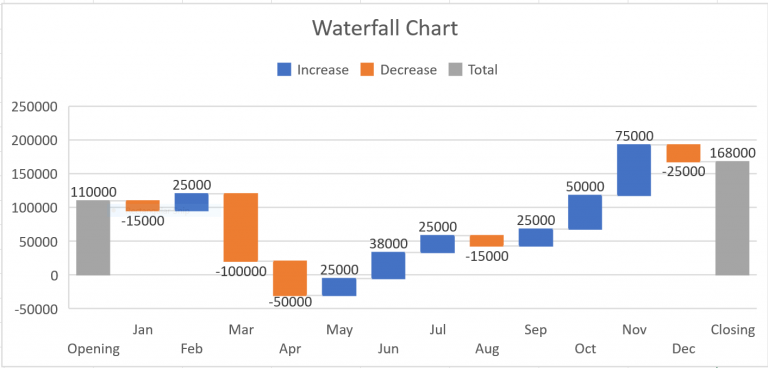
- In a similar fashion, we select the Closing Cash Position bar and choose Set as Total. The Closing Cash Position is now in gray and anchored to $0.
Our final waterfall chart is shown in Figure 4.
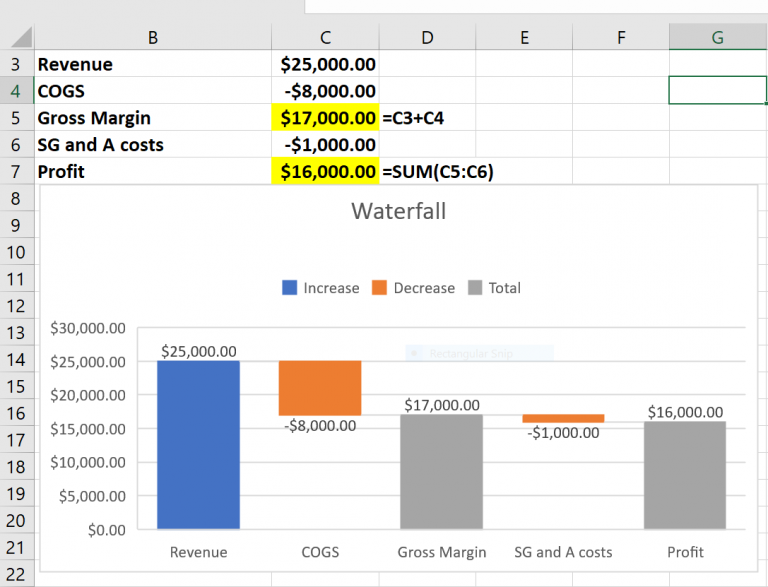
The worksheet Profit and Loss (see Figure 5) contains a waterfall chart that shows how a company’s Revenue is reduced to Profit. The chart shows that COGS has much more impact on profit than SG and A costs.
In this chart, we chose to leave the first bar colored blue but we anchored the Gross Margin and Profit bars to $0 and changed their color to gray.
Waterfall charts are easy to create and help you gain useful insights into your organization's financial data. Most importantly, with the waterfall charts Excel helps you to visualize a financial story and can provide valuable insight to decision makers at your organization.
As an accountant, you'll spend countless hours in Excel mining through your organization's data. Be sure to learn Excel's most valuable tricks and charts to ensure that you're making the most of that time. Waterfall charts are just the tip of the iceberg. Treemap and sunburst charts are also useful tools in Excel, helping you to visualize hierarchical accounting data. Here’s how to summarize data with treemap and sunburst charts.
Learn more with Excel CPE
Excel offers a wide variety of functions, formulas, and automation that can save you hours of work while improving accuracy and outcomes. To help you make the most out of this software, we offer a wide variety of CPE courses to support your learning!
Check out Becker's wide range of CPE courses that teach you to make the most of this powerful tool:
- Excel: Technical Analysis Trading Strategies
- Excel: Enterprise Risk Management
- Excel: Magic with Excel
- Excel: Solve Hard Problems in Corporate Finance
- Excel Metrics: Best Practices
- Python for Excel Users: A Gentle Introduction
These and many more Excel-focused, CPE credit-earning courses are included in Becker's Prime CPE subscription. Sign up now for 12 months of access to over 1700 on-demand, webcast, and podcast CPE courses!
Unlock Unlimited CPE with a Prime Subscription
Becker makes it easy to meet your CPE requirements, gain new skills, and stay aware of critical updates and changes in the industry!
With Prime, you can access over 1,700 courses for a full year and earn unlimited CPE credits.
Related Articles


Share


