

In September 2019, the IRS released tax gap estimates for the years 2011-2013. The recent IRS estimates show that there hasn’t been a significant change in compliance rates relative to past estimates calculated by the IRS.
The IRS estimates the tax gap from time to time to determine compliance across different types of taxpayers and identify the best allocation of resources for administering the tax code.
The gross tax gap for 2011-2013 is approximately $441 billion per year. The gross tax gap is the amount of true tax liability that is not paid voluntarily and on time.
The IRS analyzes the tax gap across three main components—non-filing, underreporting and underpayment. These components and corresponding amounts are listed below:
- Non-filing = $39 billion. The non-filing tax gap is the tax not paid on time by those who do not file the required returns on time.
- Underreporting = $352 billion. The underreporting tax gap is the net understatement of tax on timely filed returns.
- Underpayment = $50 billion. The underpayment tax gap is the amount of tax reported on timely filed returns that is not paid on time.
The tax gap is also categorized by different types of federal taxes.
- Income Taxes—Individual ($314 billion) and Corporate($42 billion)
- Employment Taxes($81 billion)
- Estate Taxes($3 billion when combined with Excise Taxes)
- Excise Taxes($3 billion when combined with Estate Taxes)
According to the IRS, the tax gap estimates translate to about 83.6% of taxes paid voluntarily and on time. The IRS estimate for 2008-2010 was 83.8%, which illustrates that compliance rates have largely remained unchanged over time.
A recent report by the Joint Committee on Taxation (JCT) helps put these numbers in perspective. The report, titled “Overview of the Federal Tax System as in Effect for 2018,” highlights some interesting tax trends over the last 75 years and makes important projections about federal tax receipts for 2018.
The JCT report contains historical tables maintained by the Office of Management and Budget (OMB), which show that the individual income tax represented 40% of Federal receipts in 1950 and has remained between 40-50% of Federal revenue for the last 75 years. The report projects that individual income taxes will account for 50% of Federal receipts in 2018.
In contrast, corporate income taxes are projected to represent just 7.2% of Federal receipts in 2018. This is a drastic decline from 1950 when corporate income taxes accounted for over 30% of federal receipts.
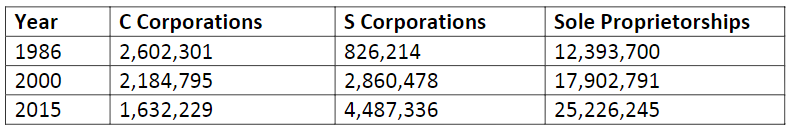
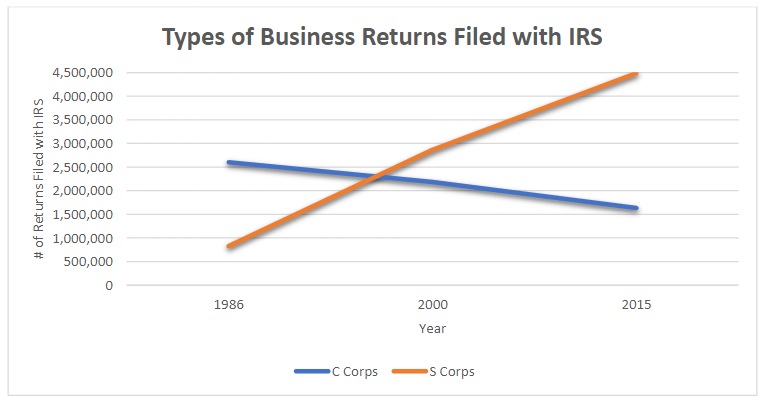
The decline associated with corporate income taxes can partly be explained by looking at the type of business tax returns filed with the IRS over the last several decades. In 1986, the last time a major overhaul of the tax code took place, the number of C corporation returns filed with the IRS was 2,602,301. By 2015, that number was just 1,632,229.
Across the same time frame, S corporation returns went from 826,214 in 1986 to 4,487,336 in 2015 and non-farm sole proprietorship returns more than doubled.
With the new business deduction provided to S corporations and sole proprietors under the Tax Cuts and Jobs Act, we can expect the number of flow-through entity returns to continue to increase over the coming years.
The decline in corporate income tax revenue has been offset by a significant increase in employment taxes over the last several decades. Between 1950 and 2010, employment taxes increased from just 10% to over 40% of Federal receipts.
The JCT report estimates that employment taxes will account for approximately 35% of Federal receipts in 2018, while estate and excise taxes together will account for less than 5% of Federal receipts in 2018. These percentages are consistent with $81 billion of the $441 billion gross tax gap coming from employment taxes, and $3 billion of the $441 billion coming from estate and excise taxes combined.
Along the same lines, as outlined above, the individual income tax accounts for approximately 50% of Federal receipts and represents $314 billion of the $441 billion gross tax gap, while the corporate income tax accounts for approximately 7% of Federal receipts and represents $42 billion of the $441 billion gap.
In summary, when the IRS and JCT reports are analyzed together, they provide consistent and detailed information regarding the federal tax system and taxpayer compliance with respect to such a system. This data can be incredibly useful to policymakers and tax administrators looking to improve upon our current system and approach.
Related Articles


Share


About the author