As an accounting professional, you know the great value that Excel adds to your work process. Learning new skills in Excel can save you endless hours and eliminate human error or repetitive tasks.
Gain even more efficiency by leveraging Goal Seek in Excel for your projects.
What is Goal Seek in Excel?
Microsoft Excel's Goal Seek function is a "what-if" analysis tool that finds a variable's target input value needed to output a desired result.1
It's extremely useful when you know the desired result, but you aren't sure what number you need in order to get there. Accountants widely use Goal Seek in Excel for tasks like budget forecasting, loan payments, break-even analysis, and more.
Example of using Goal Seek in Excel
Imagine that you have a spreadsheet that computes profit from a new product as a function of units sold. A colleague asks how many units need to be sold for the product to break even. You frantically change the value in the units sold cell until profit equals 0.
Goal Seek in Excel can provide huge value to your process. Rather than spending time and frustration guessing at numbers, Goal Seek can use the targeted result of "0" to calculate the exact number of units that need to be sold.
How to use Goal Seek in Excel
Here are the steps to activate Goal Seek:
- Click on the Data Tab and choose “What-IF Analysis” from the Forecast Group
- Select Goal Seek.
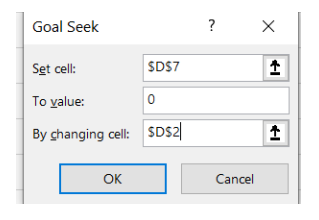
As shown in Figure 1, you need to complete the following three arguments in the Goal Seek dialog box.
- Set Cell: This is the formula that you want to force to equal a certain value.
- To Value: This is the value you want the set cell to equal.
- By changing cell: This is the cell Excel will change to force the Set Cell to hit the desired value.
Figure 1: Goal Seek Dialog Box
Goal Seek in Excel: Break-even analysis
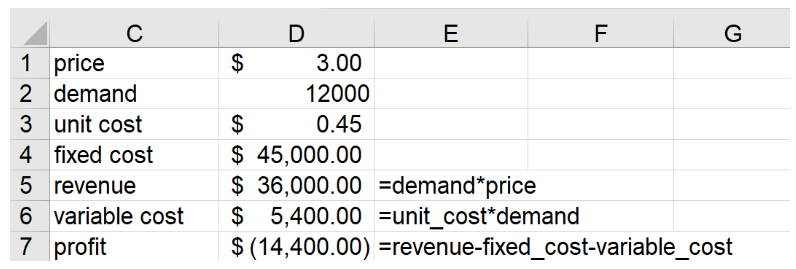
Let's look at a fictional coffee shop as our example. We want to determine the number of cups of coffee that must be sold annually for the Central Perk coffee shop to break even. We assume the unit cost for each cup of coffee is $0.45, the price per cup is $3.00 and the fixed cost of running the coffee shop for a year (rent, leasing machines, etc.) is $45,000. Figure 2 shows the formulas needed to compute Central Perk’s annual profit.
Figure 2: Central Perk Profit
As shown in Figure 2, selling 12,000 cups of coffee at the $3.00 price will result in a loss of -$14,400. We want to find the demand (cell D2) that will lead to a profiit (cell D7) that will equal zero so the business can at least break even. This task is custom-made for Goal Seek.
We will simply fill in the Goal Seek Window as shown in Figure 1, changing cell D2 so cell D7 = 0. After clicking OK, Excel quickly enters 17647.06 in cell D2 and we see that profit equals 0. Basically, Goal Seek quickly plugs different values in cell D2 until cell D7 = 0.
Since Central Perk’s profit equals (3-.45)*Demand-45,000, Goal Seek is equivalent to solving the equation (3-.45)*Demand-45,000 = 0. The point is, Goal Seek can solve any equation, no matter how complex. If there is more than one value of the changing cell that makes the Set Cell hit the desired value, Excel will just find one solution. Be glad you found one!
Goal Seek in Excel: Finding annual growth rate that makes a sales target
For our final example, let’s assume you are sure you will sell 500 units of a product in year 1 (see Figure 3). We’ll also assume that the product will sell for five years and sales will grow at 10% per year. As shown in Figure 3, total sales equal 3022.55 units. During a presentation, the boss asks what annual growth rate will result in total sales of 4000 units. You quickly bring up Goal Seek and fill in the Dialog Box as follows:
- Set Cell: D143
- Value: 4000
- By changing cell: D12
Figure 3: What Annual Growth Rate Results in Total Sales of 4000 Units?
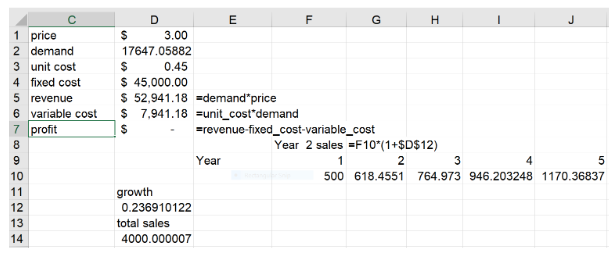
As shown in Figure 4, after applying Goal Seek Excel we find that an annual growth rate of 23.7% will result in total sales of 4000 units.
Figure 4: Final Results from Goal Seek
In this example, Excel solves for the value of growth that satisfied the equation 500+500*growth + 500*growth2+500*growth3+500*growth4= 4000. Try solving that equation algebraically!
Goal Seek in Excel: Controlling Goal Seek’s accuracy
Suppose you want a Set Cell to equal 3000. You might find that Goal Seek chooses the “By Changing Cell” so that the “Set Cell” equals 3000.001, which is close to 3000 but not equal to 3000. To make Goal Seek more accurate, we do the following:
- Select Options from the File tab.
- Choose Formulas.
- On the right of the dialog box under Calculation Options, simply reduce Maximum Change to a very small number (say 0.0000000000001).
Download Excel essentials for accountants ebook FREE
Becker's free ebook, Excel essentials for accountants: Boosting productivity and accuracy with automation, provides step-by-step instructions, clear images, and practical examples to help you learn and implement Excel's top automation features! Learn how to use formulas and functions, conditional formatting, create pivot tables, and so much more.


