Dr. Winston's Tips for Excel: Sensitivity analysis with a one-way data table


Performing a sensitivity analysis can help you gain insights into which variables are most critical and how reliable your predictions are. The information you gain can help your organization make more informed decisions. We're walking you through how to make a sensitivity analysis in Excel, specifically with a one-way data table.
What is a sensitivity analysis?
A sensitivity analysis is a method that helps you determine how different values of a particular input variable impact specific output variables under a set of assumptions. Your spreadsheet will most likely contain inputs and outputs. The inputs are assumptions we make, such as:
- Unit sales of a product will grow by 10% per year.
- Our product will generate profit margins of 30%.
- Our product will sell for five years.
- Each year 90% of subscribers will renew their magazine subscription.
Spreadsheet outputs are quantities of interest that depend on the value of the spreadsheet’s inputs. Some examples of spreadsheet outputs follow:
- Present value of the profits generated by a product.
- Profit generated this year by a coffee shop.
- Lifetime value of a magazine subscriber.
Usually, we assume a particular value for a spreadsheet input. Assumptions are often wrong! For example, in 1980 McKinsey Consulting predicted the US would have 900,000 cell phones in the Year 2000. Actually, in 2000 the US had 109 million cell phones. Since assumptions are often incorrect, it is important to determine how sensitive spreadsheet outputs are to changes in spreadsheet inputs.
We are walking you through how to use a one-way data table in Excel to conduct a sensitivity analysis so you can learn the steps and apply it to your workflows!
Sensitivity analysis in Excel
Central Perk
If you want to follow along in Excel, copy and paste the link to this file BeckerDecember20.xlsx in a new window.
The worksheet Coffee contains a simple model that computes annual profit at the Central Perk coffee shop. As shown in Figure 1 the annual demand for coffee is 65,000 -9000*price. This implies that an increase in the price of a cup of coffee will reduce annual sales by 9000 cups. In addition to the demand curve, the key inputs assumptions are the unit price (currently assumed to be $4.00) and the unit cost of producing a cup of coffee (currently assumed to be $0.45.)
We want to determine how changes in the price input affect three outputs: profit, revenue, and variable cost.
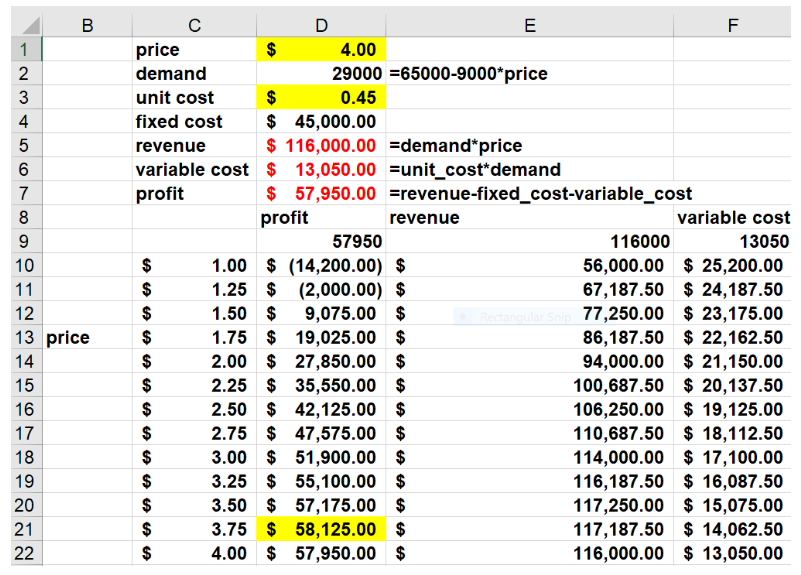
Figure 1 One-Way Data Table based on Changing Price
Suppose Central Perk is considering a price of between $1.00 and $4.00 for a cup of coffee. To determine how a price change will affect profit, revenue and variable cost we begin by entering possible prices between $1.00 and $4.00 (in 25 cent increments) down a column (in C10:C22.) Then we move up one row and over to the right one column from our first input value (this takes us to D9) and then we enter in D9:F9 the formulas (not the values) for the output cells we want calculated for different prices. We have named these cells profit, revenue, and variable_cost so we enter =profit in D8; =revenue in E8, and =variable_cost in F8.
Download our FREE ebook Excel automation for accountants
With step-by-step tutorials and real world examples, learn valuable automation functions in Excel that save time, improve accuracy, and and enhance your skills!
Constructing a one-way data table
To construct our one-way data sensitivity table in Excel we proceed as follows:
- Select the table range (in this case C9:F22) that contains the values of the spreadsheet input, the formulas to be recalculated, and the range where the calculations will be completed. When the data table is complete, for example, cells D21-F21, respectively will show the profit, revenue, and variable cost corresponding to a price of $3.75.
- From the Forecast Groupon the Data Tab, select What-If Analysis and then choose Data Table.
- Then fill in the dialog box as shown in Figure 2. A one-way data table with the inputs going down a column has no row input cell. Defining D1 as the column input cell tells Excel to input each price in the 1stcolumn of the table range (cells C10:C22) into the Column Input Cell (D1) and then compute each of our output cells.
- We find, for example, that a price of $3.75 yields a profit of $58,125, revenue of $117, 187.50, and a variable cost of $14,062.50. We highlighted cell D21 to show that a price of $3.75 maximizes profit.
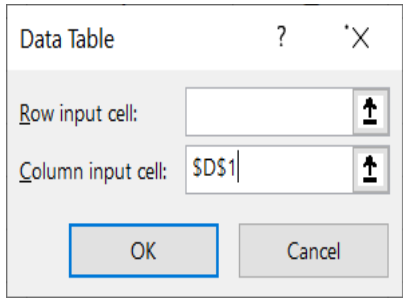
Figure 2 Dialog Box for sensitivity table in Excel
Using your one-way data table for your sensitivity analysis
By default, Data Tables recalculate whenever you change the spreadsheet. If you find that the recalculation of the Data Tables in a large spreadsheet annoys you, then from the Formulas tab go to Calculation Options and change the option to Automatic Except for Tables. Then your spreadsheets will not recalculate unless you hit the F9 key.
If you hit the Delete key when you are in any of the calculated cells in a data table, you will be told you can’t delete any part of a data table.
If you hover over any calculated cell in our data table, then you will see the formula ={TABLE(,D1). This formula tells you that the data table has no Row input cell and the column input cell for the Data Table is D1.
Sensitivity analysis in Excel is essential to avoid incorrect data assumptions. For further understanding, read our instruction on two-way data tables.
Learn more with Excel CPE
Excel offers a wide variety of functions, formulas, and automation that can save you hours of work while improving accuracy and outcomes. To help you make the most out of this software, we offer a wide variety of CPE courses to support your learning!
Check out Becker's wide range of CPE courses that teach you to make the most of this powerful tool:
- Excel: Technical Analysis Trading Strategies
- Excel: Enterprise Risk Management
- Excel: Magic with Excel
- Excel: Solve Hard Problems in Corporate Finance
- Excel Metrics: Best Practices
- Python for Excel Users: A Gentle Introduction
These and many more Excel-focused, CPE credit-earning courses are included in Becker's Prime CPE subscription. Sign up now for 12 months of access to over 1700 on-demand, webcast, and podcast CPE courses!
Unlock Unlimited CPE with a Prime Subscription
Becker makes it easy to meet your CPE requirements, gain new skills, and stay aware of critical updates and changes in the industry!
With Prime, you can access over 1,700 courses for a full year and earn unlimited CPE credits.