

Yankee Hall of Fame catcher Yogi Berra said, “Forecasting is hard, especially about the future,” and while this is a funny quote, it's also not wrong. Working in finance and accounting often requires you to forecast future revenue, unit sales or profits. Fortunately, you don't need a crystal ball, you just need the Excel Forecast function to provide the insight you need. To help you get started, we're breaking down how to use it.
What does the Excel Forecast function do?
The Forecast function predicts a future value based on existing values using linear regression to project future data points along a line that best fits the historical data. You can use this past data to forecast sales, plan your budget, or predict future trends or short-term increases or decreases.
The Excel Forecast function is expressed as: FORECAST(x, known_y's, known_x's)
- X is the x-value for which you want to predict the y-value.
- Known_y's is the dependent array or range of data, or the historical data. This may be sales, inventory, payroll amount, or another variable you're trying to forecast.
- Known_x's is the independent array or range of data, or corresponding historical data. This may be the month or date in which the known y's, or dependent historical data, occurred
Without forecasting in excel, you could manually calculate a forecasted value using the formula for linear regression: FORECAST(x) = a + bx.
- B is the slope of the line
- A is the intercept of the line
- Those values are calculated based on the known x's and y's data points.
Forecasting in Excel does the work for you, saving you a lot of time and ensuring a more reliable output.
How to use the Excel Forecast function
Today’s work will be in the Forecasting with Excel spreadsheet. Within this spreadsheet, we’ll use monthly U.S. vehicle sales in thousands for the years 2014-2018 to forecast monthly sales for the years 2019-2020. Please note: your data must be in a .xlsx (not .xls) file to use the Forecast Sheet tool.
Here are step-by-step instructions.
- To begin, select the dates and sales that we’ll use to generate forecasts. For 2015-2018 we select the cell range A5:B64.
- Then, from the Forecast Group on the Data Tab we selected Forecast Sheet. Since we want to forecast monthly sales for 2019 and 2020, we change the Forecast End Date to 12/1/2020 (see Figure 1).
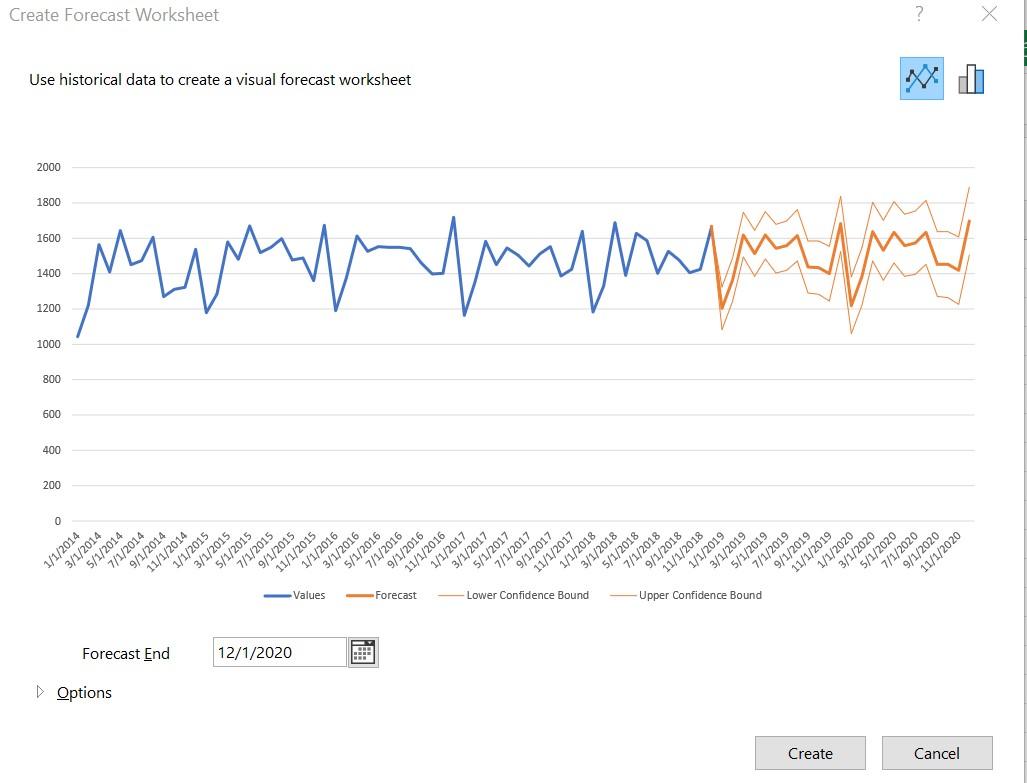
Figure 1 Monthly Auto Sales
In Figure 1, 2015-2018 monthly sales are in blue and monthly forecasts for 2019-2020 are in orange. Excel provides forecasted monthly sales in 2019 and 2020 with 95% probability. After clicking Create, you find the forecasts and lower and upper values for the 95% confidence interval in a new worksheet (see Figure 2). For example, cells D52 and E52 tell us that we are 95% sure that January 2019 auto sales will be between 1084.7 and 1323.5.
We copied the actual 2019 and 2020 sales into this worksheet. For example, for January 2019, actual sales were 1172.04 and our forecast was 1204.11. Thus, our absolute percentage error (APE) (see cell E52) is the absolute value of (1172-1204)/1172 = 2.7% For 2019, our Mean Absolute Percentage Error (MAPE) is a respectable 4.8%
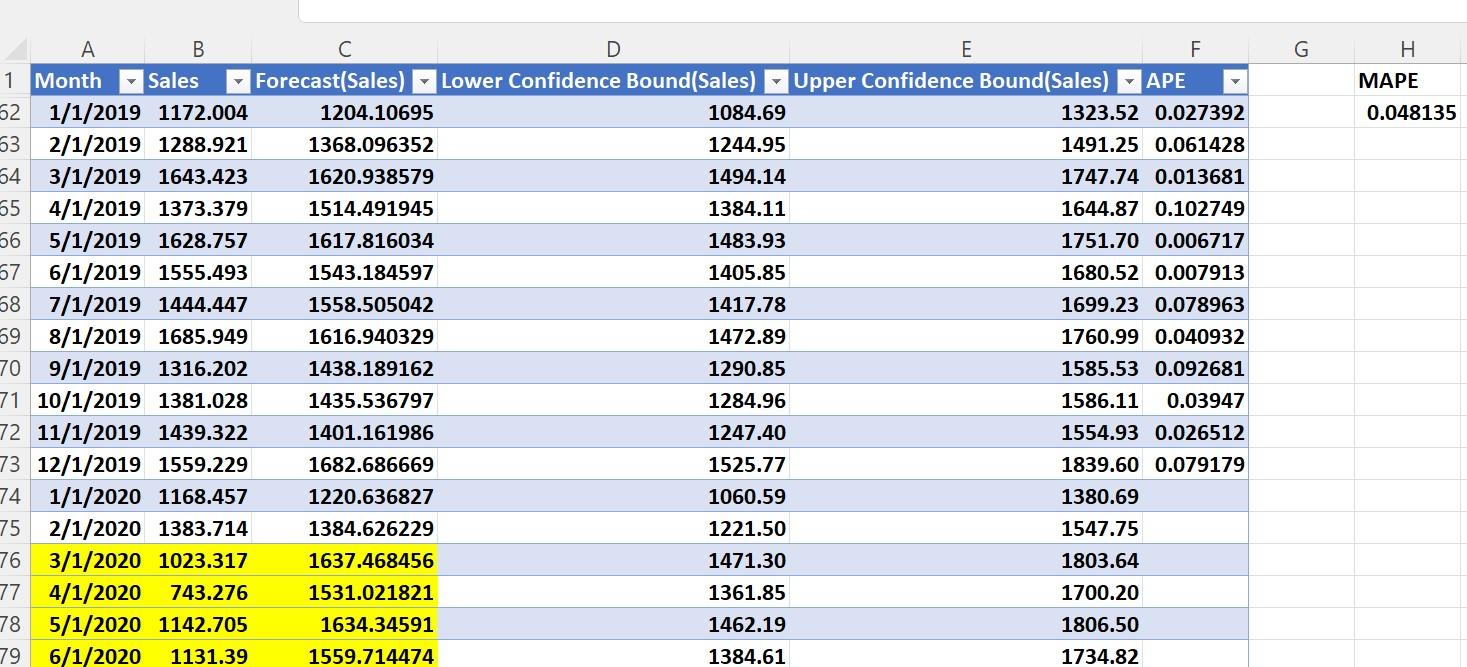
Figure 2 Monthly Auto Sales Forecasts
The Forecast Sheet creates forecasts by using the trend and seasonal characteristics of the given data (2015-2018). In other words, the Forecast Sheet forecasts the future by assuming the future will behave in a fashion like the past data that was used to create the forecast. Note that for the period March-June 2020 our forecasts are much larger than the actual sales. This is because there was no way Excel could have foreseen the occurrence of COVID lockdowns, which greatly reduced auto sales.
You can test whether the Forecast Sheet tool provides acceptable forecasts for your organization. To do this, forecast several time periods using the previous 5 years of data. If the Forecast Sheet yields a smaller MAPE than your current forecasting method, the Forecast Sheet may be an easy method to create useful forecasts.
Download our FREE ebook Excel automation for accountants
With step-by-step tutorials and real world examples, learn valuable automation functions in Excel that save time, improve accuracy, and and enhance your skills!
Take the next step with Excel CPE courses
Excel offers a wide variety of functions, formulas, and automation that can save you hours of work while improving accuracy and outcomes. To help you make the most out of this software, we offer a wide variety of CPE courses to support your learning!
Check out Becker's wide range of CPE courses that teach you to make the most of this powerful tool:
- Excel: Technical Analysis Trading Strategies
- Excel: Enterprise Risk Management
- Excel: Magic with Excel
- Excel: Solve Hard Problems in Corporate Finance
- Excel Metrics: Best Practices
- Python for Excel Users: A Gentle Introduction
These and many more Excel-focused, CPE credit-earning courses are included in Becker's Prime CPE subscription. Sign up now for 12 months of access to over 1700 on-demand, webcast, and podcast CPE courses!