

When you need to analyze a large quantity of data, taking a random sample helps you to make accurate, unbiased conclusions such as assisting with market or product research. To help you get started, we're sharing three ways to use Excel for random sampling and random selection with steps and images.
Download our FREE ebook Excel automation for accountants
With step-by-step tutorials and real world examples, learn valuable automation functions in Excel that save time, improve accuracy, and and enhance your skills!
Using a random sample to pull a fraction of data
Taking a random sample in Excel offers several advantages for accountants dealing with large datasets, including:
- Unbiased representation: Each item in the population has an equal chance of selection, creating a sample that accurately represents the entire dataset.
- Efficiency: Accountants can analyze a smaller, manageable subset of data, which saves time and resources without sacrificing reliable insights.
- Accuracy: Random sampling minimizes selection bias and reduces the likelihood of skewed results.
- Compliance and auditing: Random sampling is often needed for auditing standards and compliance checks.
Let's look at three ways to select a random sample in Excel.
Using data analysis to select a random sample (Office 365 users)
The easiest way to randomly select in Excel is using the Data Analysis toolbar. To access this, you may need to add the Analysis ToolPak. Simply go to File > Options > Add-ins. Then, in the Manage box, you'll select Excel Add-ins and click Go. Check the Analysis ToolPak option and click Ok.

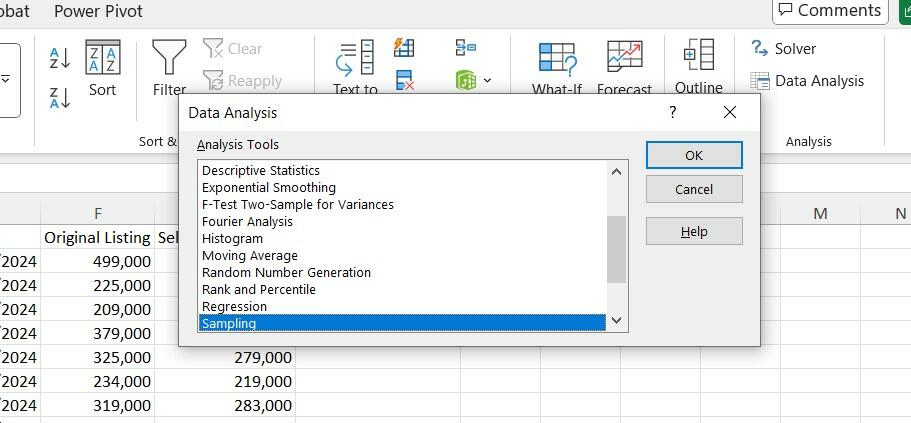
Once you have the Analysis ToolPak enabled, you can go to the Data tab and choose Data Analysis. A box will pop up with options for how to analyze data, and you can scroll down to select Sampling and click OK.
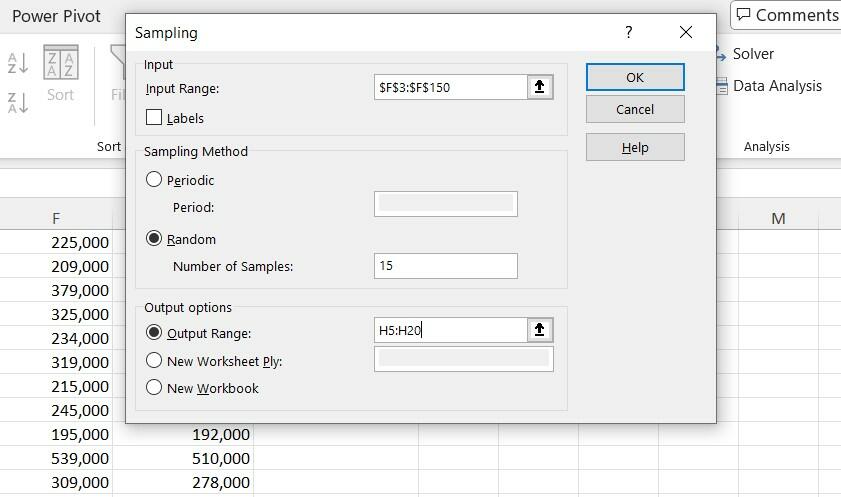
After you select Ok, another box will pop up where you can choose the data you want to sample from, how many samples you need, and where it will go. For example, we want to pull a random selection of 15 house prices from a spreadsheet, which are in column F, and have the sample listed in column H.
Using a formula to create a random sample (Office 365 users)
You can also use the SORTBY formula to create a random sample. Say we want to interview 50 random NBA players about a new rule from the 477 players. We have a list of the players names and that's really all we need. Using SORTBY with a RANDARRAY, we can sort the players randomly into a list.
The formula =SORTBY(G3:G480,RANDARRAY(COUNTA(G3:G480))) in cell J3 is a dynamic array formula, which can create results in multiple cells and automatically updates if the list of players in G3:G480 updates. This formula generates 477 random numbers via the =RAND() function. Then, these random numbers will be used to sort the player list.
The SORTBY portion of the formula sorts the list based on the random numbers. The default is ascending order, but descending order would work fine. The first 50 players listed would be your random sample. If you press the F9 key, your spreadsheet will recalculate the random numbers and you will have a new random sample.
In the example below, you'll see the formula in action that shuffles a list of NBA players.

How to create a random sample without Office 365
The RAND() function is another way to take a random sample. If you enter the function =RAND() in a cell, Excel is equally likely to return any number between 0 and 1. For example, there is a 10% chance you will see a number between 0 and 0.1 and a 20% chance you will see a number between 0.8 and 1. The value returned by RAND() functions are independent, which means that the value returned by RAND() in any cell has no effect on any other RAND() values in the workbook.

To generate our random sample, walk through the following steps:
- Generate a random number for each player by copying from B3 to B4:B480 the formula = rand().
- “Freeze” the random numbers by copying the range B3:B480 and then select Paste Special Values.
- Now, sort the range A3:B480 on Column B (we chose sort smallest to largest). This step effectively shuffles the players so each player has the same chance to be in any position on the list.
- The first 50 players listed are your random sample of 50 players; each subset of 50 players has the same chance of being chosen.
That's all there is to it!
Download your free guide to Automation in Excel
New updates to Excel make it easier than ever to build shortcuts, automate functions, and create tables that provide a clear overview of valuable information. To help you make the most of Excel, download our free Ebook, "Excel Essentials for Accountants: Boosting Productivity and Accuracy with Automation," and learn how to record macros, build pivot tables, and automate tasks and calculations in a snap!
Download our FREE ebook Excel automation for accountants
With step-by-step tutorials and real world examples, learn valuable automation functions in Excel that save time, improve accuracy, and and enhance your skills!
Related Articles


Share


