Sifting through and analyzing data is nothing new for accountants—what's changed is the volume of data you're dealing with and the demand for faster and more in-depth analysis. Let's look at how "big data" affects the accounting profession, how it can benefit you, and tips on harnessing big data in accounting more effectively.
What is big data?
Big data is the term used to describe a collection of data sets that are so large and complex that traditional databases or other tools can't process or analyze them. Instead, organizations dealing with big data will implement a robust data infrastructure to store, extract, transform, and load the information so it's sorted, cleaned, and functional throughout the organization.
The five V's of big data
For data sets to qualify as big data, they must meet at least one (but usually all) of the five V's.
- Volume: The amount of data is enormous and often measured in terabytes or more
- Variety: Data comes from different sources in both structured and unstructured formats, like open text
- Velocity: Data is generated, processed, and analyzed rapidly, sometimes in fractions of a second
- Veracity: Because data comes from all sources, there are varying degrees of quality and accuracy
- Value: The data gathered provides significant insights to the organization
A typical server's processing power simply can't handle big data.
Sources of big data
Data is generated across a variety of sources, including, but not limited to:
- Transactional data: Product sales, payments, purchase times and locations
- Social data: Using social media platforms to pull information from posts, comments, and engagement to gain insight into user behavior and preferences
- Consumer Data: Ethnicity, gender, online behavior, etc.
- Sensor Data: This refers internet of things (IoT) and the data collected - consider a smart refrigerator, smart watch, or even a medical device that can gather data and send it to the medical facility and physician.
- Syndicated Data: Generalized market data not specific to a single organization or an aggregated collection of data, such as survey data
Learn more about data, deep learning, and generative AI in this conversation from the Becker Accounting Podcast, Balancing the Future: Demystifying AI.
Examples of big data and analytics
To help you visualize big data, consider a streaming service like Netflix. They generate and collect vast amounts of data from their platform, such as what different demographics are watching, the most popular movies and shows, watch times, price points that cause people to sign up or drop service, and how people watch (ie: mobile devices, smart tv, etc). They're also using social media, surveys, and more to collect data and learn more about the feelings surrounding Netflix, rather than just user activity and information.
As they collect and generate data, they're putting it to work—looking for trends and planning more content, seeing what to remove from the platform and what licenses to renew, creating algorithms that will feed recommendations, and analyzing what could trigger an increase in either subscriptions or cancellations.
Big data in accounting
Now that you have a solid understanding of what big data is, let's apply it to accounting. An example of big data in accounting would be the analytics that accounting firms and financial institutions use to identify patterns and anomalies in transactions. This information can indicate fraudulent activities.
As the amount of data scales up and comes from transaction records, customer behavior, and external databases, you can use systems to detect potential fraud more quickly and accurately.
Using big data in accounting
Nearly every branch of the profession can leverage big data.
- Audit: Like in the example above, big data, when processed with the proper tools can provide more valuable insights and find mistakes or areas of concern more effectively. providing a better experience for the client and the auditor.
- Accounting: Big data can identify questions, help monitor and improve business performance, and build analytical models that support a variety of product or operational improvements.
- Tax: Big data offers the opportunity to analyze efficiencies more easily, identify tax-related opportunities for improvement, and aid in evaluating global opportunities.
- Managerial accounting: This is where big data is probably at its best, improving risk identification, creating more accurate forecasts, and providing a more robust overall picture of the organization's financial landscape.
Integrating big data in accounting: Using analytics
As your organization collects and generates data, you must manage and analyze it to extract insights. There are three types of analytics techniques to pull raw data into functional information.
- Descriptive analytics: This summarizes historical data, such as analyzing sales data from the previous quarter to determine which products offered the highest profits.
- Predictive analytics: This uses statistical models and machine learning to forecast future outcomes based on the historical data. For example, you could use this method to answer the question, "If we spend $1 million more on marketing this quarter, how will it impact sales?"
- Prescriptive analytics: This advanced technique predicts future outcomes and recommends actions to achieve desired results using a combination of data, algorithms, and machine learning. You could get insight to the question, "What is the ideal spend for marketing this quarter?" and learn how to improve the impact of your marketing budget.
Methods of leveraging big data in accounting
Let's look at decision models and data visualization to learn how to better use analytics to gain insight into your data.
Decision models
One of the ways data and analytics are frequently used is with decision models. These are mathematical representations of a problem or business situation used to analyze and make a decision. Decision models typically contain some controlled data, such as the number of salespeople. And, they often include some uncontrolled data, such as interest or unemployment rates. If you were in the mortgage business, a decision model might be used to estimate the ideal number of mortgage processors to employ given the number of salespeople and an estimation of interest rates.
Data visualization
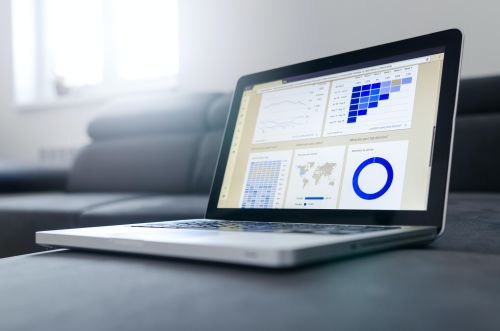
Data visualization is another way in which analytics are used in business and industry. Simple graphs are one example, however, in the last several years a whole field has emerged to help analysts provide more visualization into data and information. Dashboards are a great way to visualize many different metrics quickly, with drill-down capabilities to explore concerns or questions more deeply. A whole category of software specializing in the visualization of big data has emerged alongside the growth of the big data industry.
The topic of big data is sure to continue growing quickly. Professionals and accountants would be wise to continue their professional education in this area.
Learn more about big data and analytics with Becker CPE
Becker offers a wide variety of CPE to help you build skills in the topics that matter the most to you. To learn more about data and analytics, consider these courses:
- Performing and Interpreting Data Analytics
- Foundations in Data and Analytics for the Accounting Profession
Or get a comprehensive education in data and analytics with Becker's CPE certificate program, Data & Analytics for Business Professionals.


